Arbitrary hand-crafted fillable shapes for ggplot2
Source:R/geom_casting.R, R/utils.R
geom_casting.Rd![[Experimental]](figures/lifecycle-experimental.svg)
Arbitrary hand-crafted colourable and fillable shapes for ggplot2.
New shapes may be feature requested via a Github issue.
Copies the grob tree, editing only the placement viewports; the styled picture grobs are shared with the template and left untouched.
Usage
geom_casting(
  mapping = NULL,
  data = NULL,
  stat = "identity",
  position = "identity",
  ...,
  na.rm = FALSE,
  show.legend = NA,
  inherit.aes = TRUE
)
Arguments
- mapping
A set of aesthetic mappings created by
aes(). If specified andinherit.aes = TRUE(the default), it is combined with the default mapping at the top level of the plot.- data
A data frame to use for the layer. If
NULL(the default), the data inherited from the plot is used.- stat
The statistical transformation to use on the data for this layer. The default is
ggplot2::stat_identity().- position
A position adjustment to use for overlapping points on this layer. The default is
ggplot2::position_identity().- ...
Other arguments passed on to the layer. These are often aesthetics, used to set an aesthetic to a fixed value, like
colour = "red"orsize = 0.1. They may also be parameters to the paired geom, such asnudge_x,nudge_y,hjustandvjust.sizeis panel-relative: it sets the shape's width and height as a fraction of the panel, sosize = 0.1spans a tenth of the panel, not millimetres.- na.rm
If
FALSE, the default, missing values are removed with a warning. IfTRUE, missing values are silently removed.- show.legend
Logical. Should this layer be included in the legends?
NA, the default, includes if any aesthetics are mapped.FALSEnever includes, andTRUEalways includes.- inherit.aes
If
FALSE, overrides the default aesthetics, rather than combining with them.
Details
Behind the scenes, a pair of vector images (outline & fill) are converted into Cairo graphics library SVG files, then into grid graphical objects (grobs) for use in a ggplot2 layer.
By default, the "violin" shape is used.
If the shape is mapped to a variable, e.g. aes(shape = factor(cyl)), then
scale_shape_manual() is also required to explicitly name the desired
shapes as a character vector (see examples). This is because standard
shapes are associated with a number, e.g. a circle is 19, whereas
geom_casting() shapes are associated only with character strings.
Aesthetics that vary per observation, e.g. a continuous fill, are
respected for each individual shape, whether grouping is implicit or
explicitly shared with group = 1. A fill of NA or "transparent"
renders the outline only: for shapes such as the "bowl" set, this hides
the steam while retaining the bowl outline. The quill's shaft and ink
mark use colour, so the mark remains visible when its feather fill is
transparent. For the "halloween" set's skeleton and spiderweb, fill
colours the narrow interiors of bones and threads, so its effect is
subtler than on a book or ghost.
Placement exception: whereas other shapes are centred on their plotting coordinate, the quill's ink-contact point is placed there, so the nib touches the data point as if writing it. The whole quill is centred in legend keys for readability.
In addition to the supported aesthetics below, nudge_x, nudge_y,
hjust and vjust are also respected.
Aesthetics
geom_casting() understands the following
aesthetics (required aesthetics are in bold):
xyalphaanglecolourfillgroupshapesize
Learn more about setting these aesthetics in
vignette("ggplot2-specs")
Examples
library(ggplot2)
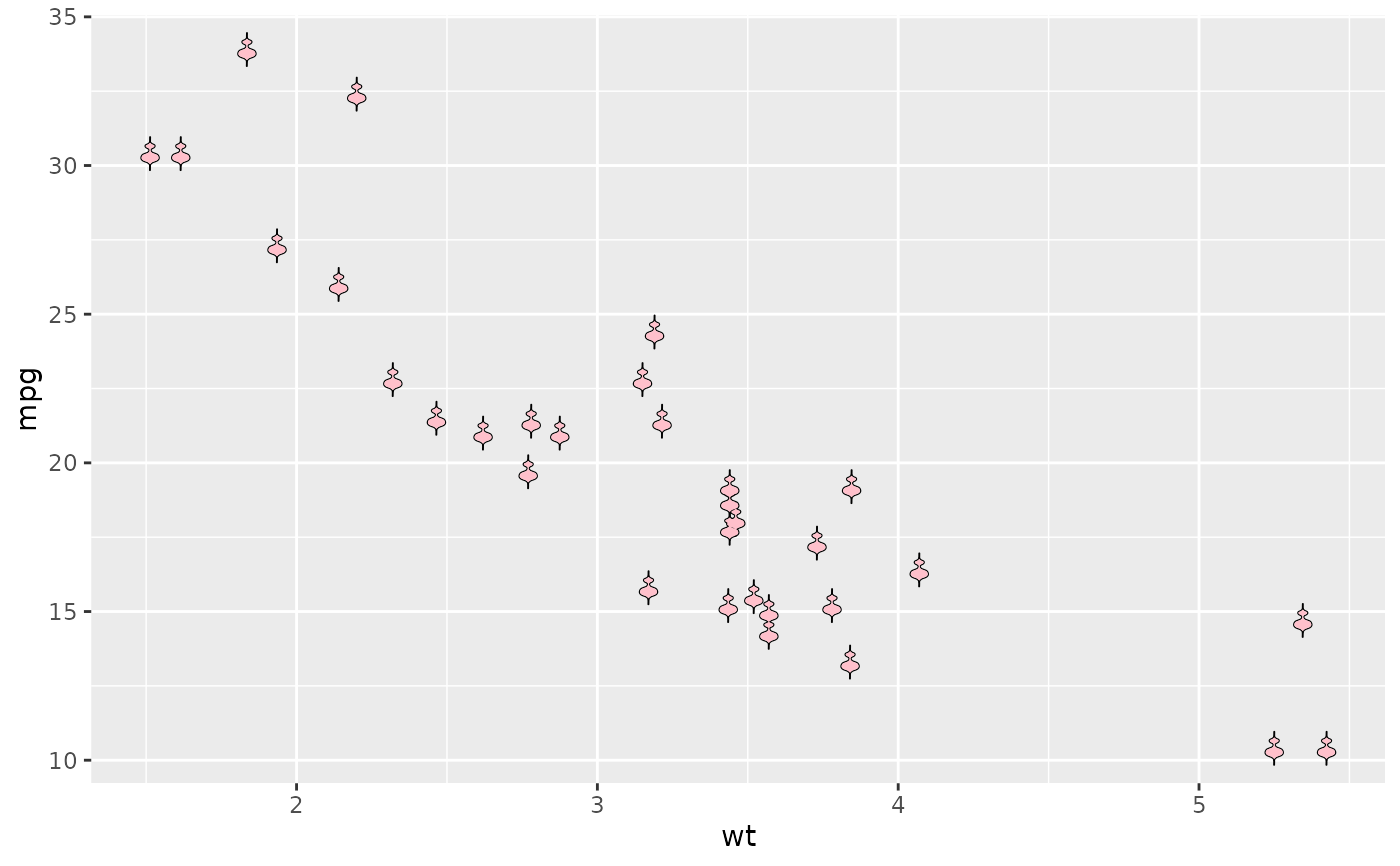
# "Baby violin" shape by default
p <- ggplot(mtcars, aes(wt, mpg))
p + geom_casting()
 # Change shape & fill
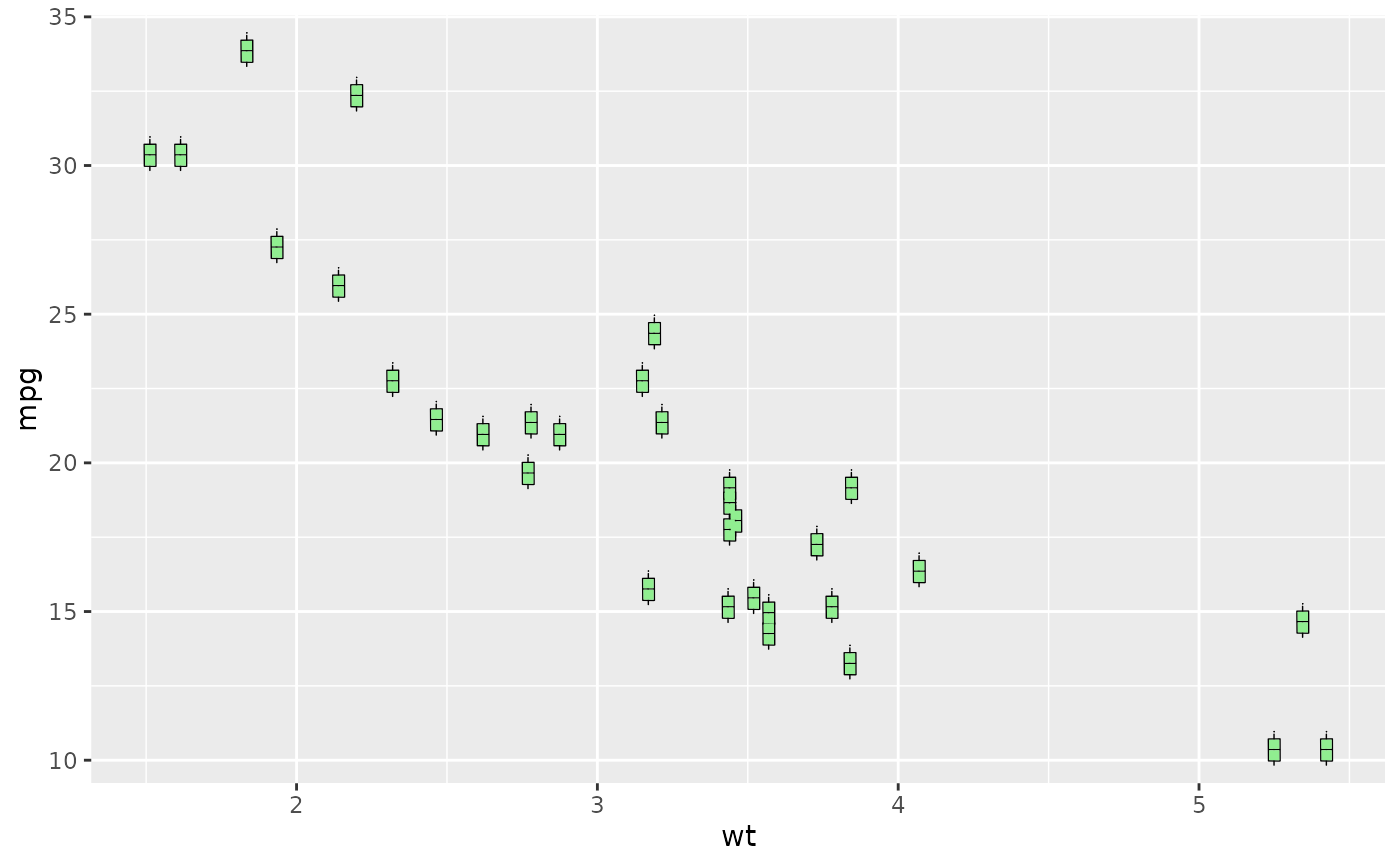
p + geom_casting(shape = "box", fill = "lightgreen")
# Change shape & fill
p + geom_casting(shape = "box", fill = "lightgreen")
 # Shapes mapped to a variable
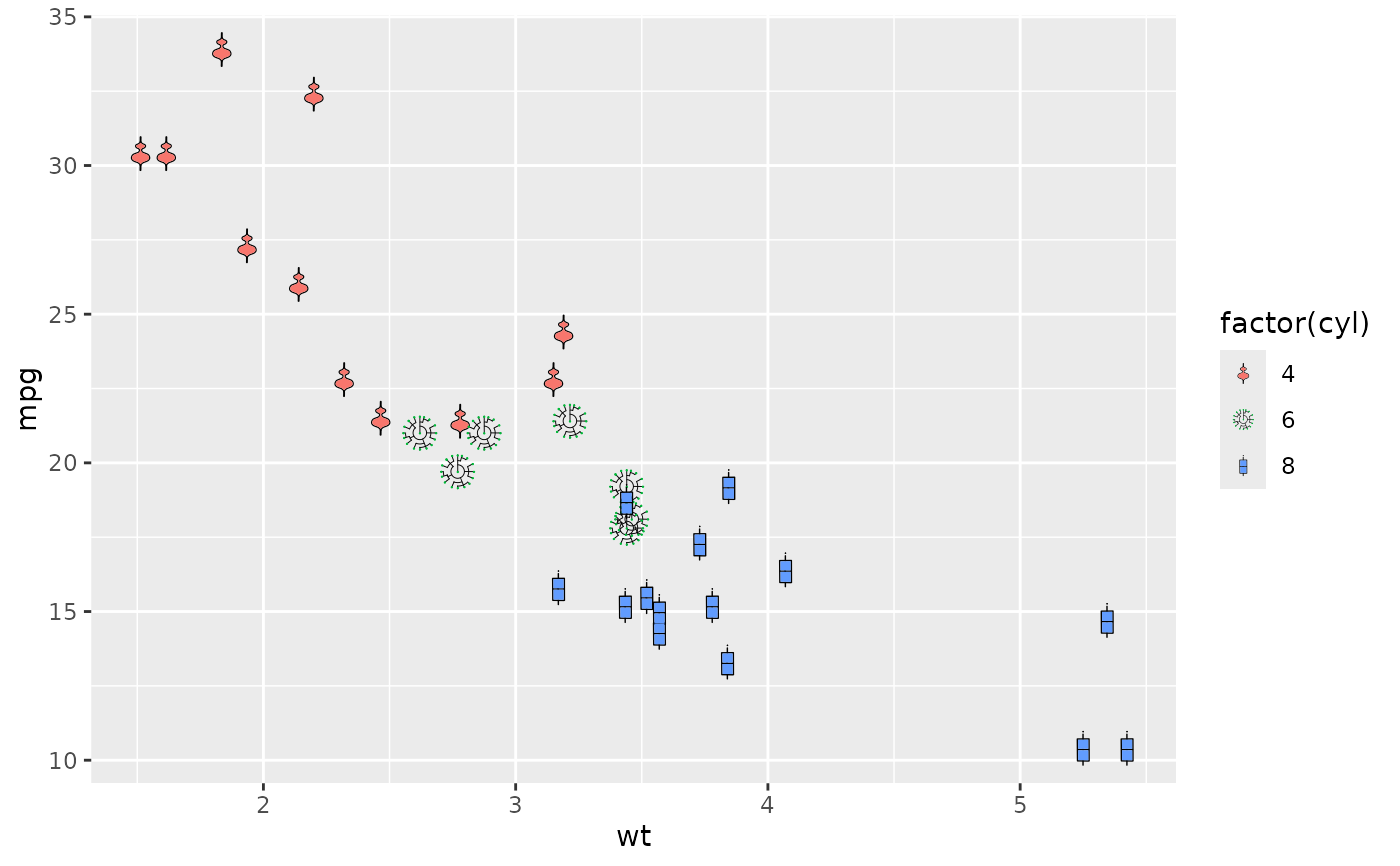
ggplot(mtcars, aes(wt, mpg, fill = factor(cyl))) +
geom_casting(aes(shape = factor(cyl))) +
scale_shape_manual(values = c("violin", "dendro", "box"))
# Shapes mapped to a variable
ggplot(mtcars, aes(wt, mpg, fill = factor(cyl))) +
geom_casting(aes(shape = factor(cyl))) +
scale_shape_manual(values = c("violin", "dendro", "box"))
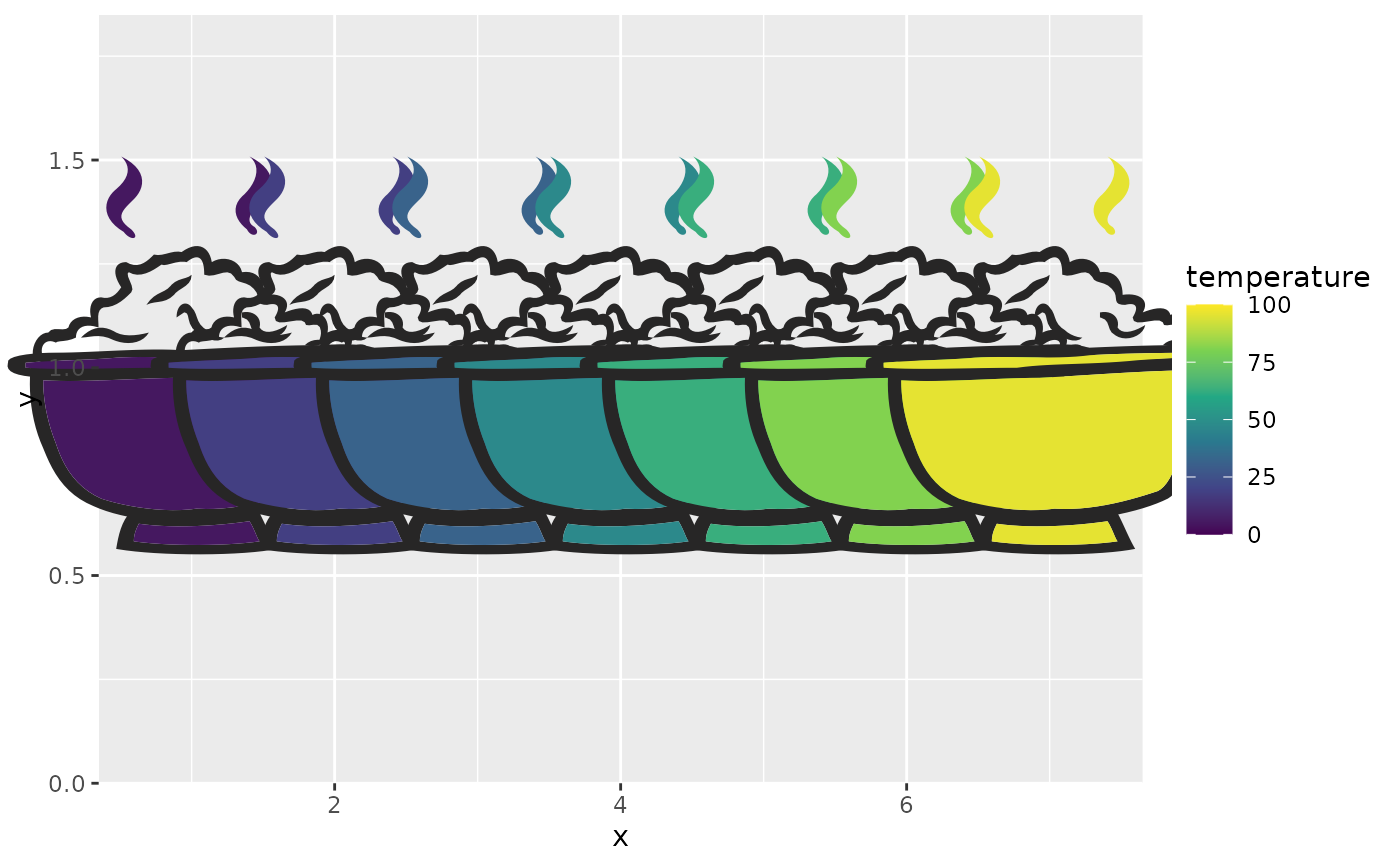
 # Continuous fill varies per observation, without a grouping workaround
ggplot(data.frame(x = 1:7, temperature = c(5, 18, 32, 47, 63, 81, 96)),
aes(x, 1, fill = temperature)) +
geom_casting(shape = "bowl2", colour = "#272626", size = 0.72) +
scale_fill_viridis_c(limits = c(0, 100)) +
scale_x_continuous(limits = c(0.35, 7.65), expand = expansion(mult = 0)) +
scale_y_continuous(limits = c(0, 1.85), expand = expansion(mult = 0))
# Continuous fill varies per observation, without a grouping workaround
ggplot(data.frame(x = 1:7, temperature = c(5, 18, 32, 47, 63, 81, 96)),
aes(x, 1, fill = temperature)) +
geom_casting(shape = "bowl2", colour = "#272626", size = 0.72) +
scale_fill_viridis_c(limits = c(0, 100)) +
scale_x_continuous(limits = c(0.35, 7.65), expand = expansion(mult = 0)) +
scale_y_continuous(limits = c(0, 1.85), expand = expansion(mult = 0))